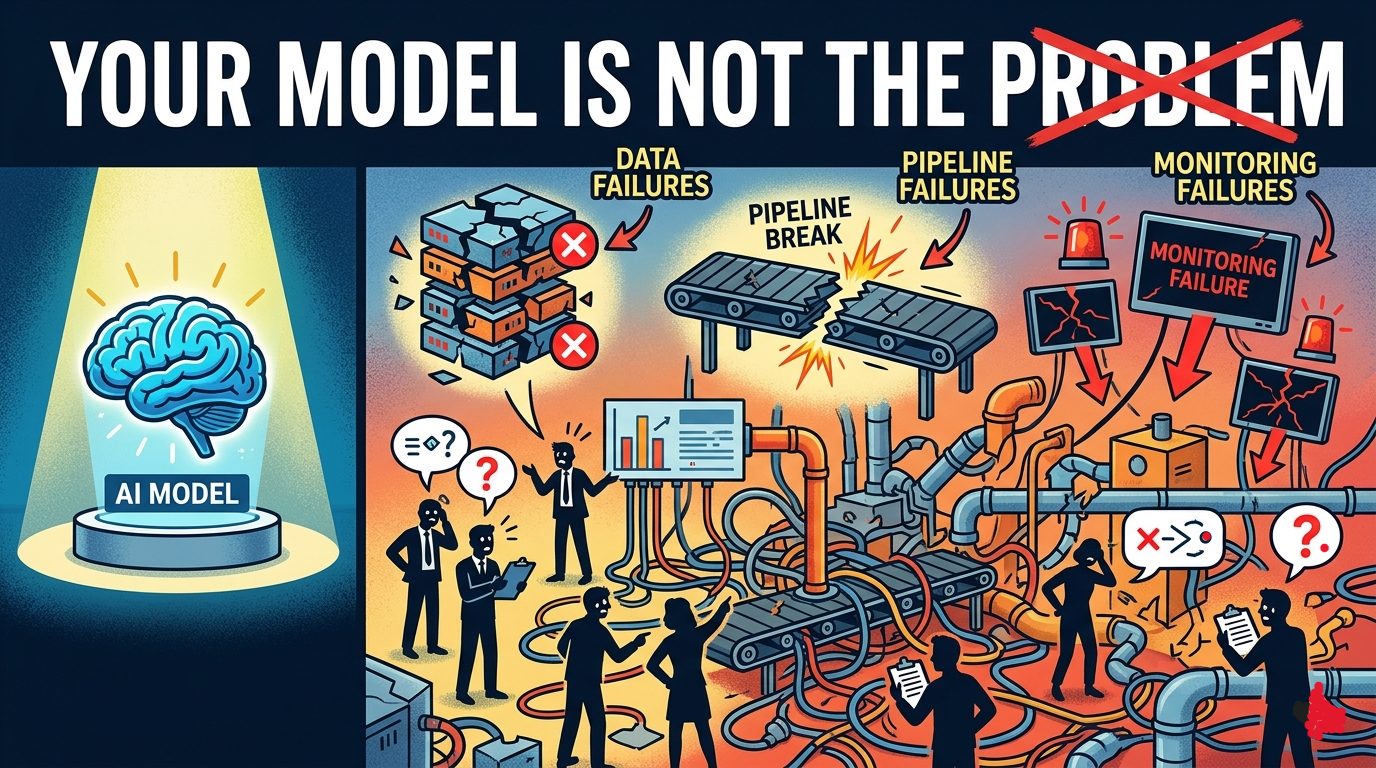
Your Model Is Not the Problem
When a machine learning system starts behaving badly in production, the first instinct of almost every team is to look at the model. Retrain it. Try a different architecture. Adjust the hyperparameters. Collect more data. The model is the complicated, expensive, hard-to- understand part of the system, and when something goes wrong, the complicated part gets the blame.
In my experience, this instinct is wrong the majority of the time.
The model is usually fine. The model is doing what it was trained to do, with the inputs it is being given, and producing outputs that are reasonable given those inputs. The problem is the inputs. Or the pipeline that produces the inputs. Or the serving infrastructure that passes the inputs to the model. Or the monitoring that is failing to detect that inputs have drifted from what the model was trained on. Or the feature engineering code that was written one way in the training notebook and a slightly different way in the production serving path.
The model is the part of the system that gets the most attention during development and the least rigorous engineering treatment in production. The pipeline that feeds it, serves it, monitors it, and maintains it is the part that determines whether the whole system actually works. Most MLOps practice gets this ratio backwards.
The training-serving skew nobody talks about enough
Training-serving skew is the condition where the data the model sees at inference time is distributed differently from the data it was trained on. This is the most common source of silent ML degradation in production, and it is silent because most monitoring setups do not detect it.
It manifests in two ways. The obvious version is concept drift: the underlying relationship between features and labels changes over time. A model that predicts customer churn was trained on data from before an economic recession. The features that predicted churn in a stable economy are different from the features that predict churn when customers are cutting discretionary spending. The model is not wrong. The world changed.
The less obvious version is feature skew: the features computed during training are computed differently from the features computed at serving time. This is an engineering failure rather than a statistical one, and it is more common than teams admit because it requires a level of pipeline discipline that most ML teams have not established.
# The training notebook:
def compute_user_features(user_id: str, lookback_days: int = 30) -> dict:
    events = load_events(user_id, days=lookback_days)
    return {
        "session_count": len(events),
        "avg_session_duration": sum(e.duration for e in events) / len(events),
        "days_since_last_session": (datetime.now() - events[-1].timestamp).days,
    }

# What got deployed to production six months later
# by a different engineer who reimplemented from memory:
def compute_user_features_serving(user_id: str) -> dict:
    events = fetch_recent_events(user_id, limit=100)  # limit, not lookback_days
    if not events:
        return {"session_count": 0, "avg_session_duration": 0, "days_since_last_session": 999}
    return {
        "session_count": len(events),
        "avg_session_duration": sum(e.duration_seconds for e in events) / len(events),
        # duration vs duration_seconds: training used minutes, serving uses seconds
        "days_since_last_session": (datetime.utcnow() - events[0].created_at).days,
        # events[-1] vs events[0]: training used oldest, serving uses newest
    }
These two functions look similar. They produce different numbers. The model was trained on features from the first function and is being served features from the second. The model has not changed. The model is receiving inputs that are systematically different from what it learned from. The predictions are quietly wrong.
The team spent two weeks examining the model before someone noticed
that duration in the training data was measured in minutes and
duration_seconds in the serving path was measured in seconds.
The fix for this is not better models. It is the same code running in training and serving, enforced structurally rather than by convention.
# Feature computation as a shared library.
# Training and serving import from the same place.
# There is one implementation. There cannot be drift between two.

# features/user_features.py
from dataclasses import dataclass
from datetime import datetime, timezone
from typing import Optional
import numpy as np


@dataclass
class UserFeatures:
    session_count: int
    avg_session_duration_minutes: float
    days_since_last_session: int
    sessions_last_7_days: int
    sessions_last_30_days: int


def compute_user_features(
    events: list,
    reference_time: Optional[datetime] = None,
) -> UserFeatures:
    """
    Compute user features from a list of session events.

    Args:
        events: List of session events, sorted descending by timestamp.
        reference_time: The point in time to compute features relative to.
                        Defaults to now. Pass explicitly in training to
                        ensure reproducibility.
    """
    if reference_time is None:
        reference_time = datetime.now(timezone.utc)

    if not events:
        return UserFeatures(
            session_count=0,
            avg_session_duration_minutes=0.0,
            days_since_last_session=999,
            sessions_last_7_days=0,
            sessions_last_30_days=0,
        )

    durations_minutes = [e.duration_seconds / 60.0 for e in events]

    last_session_time = events[0].timestamp
    days_since_last = (reference_time - last_session_time).days

    seven_days_ago = reference_time.timestamp() - (7 * 86400)
    thirty_days_ago = reference_time.timestamp() - (30 * 86400)

    return UserFeatures(
        session_count=len(events),
        avg_session_duration_minutes=float(np.mean(durations_minutes)),
        days_since_last_session=days_since_last,
        sessions_last_7_days=sum(
            1 for e in events if e.timestamp.timestamp() > seven_days_ago
        ),
        sessions_last_30_days=sum(
            1 for e in events if e.timestamp.timestamp() > thirty_days_ago
        ),
    )


# Training uses this:
# features = compute_user_features(events, reference_time=label_date)

# Serving uses this:
# features = compute_user_features(events, reference_time=datetime.now(timezone.utc))

# Same function. Same logic. No drift possible.
The monitoring that does not monitor
Most ML monitoring setups in production measure two things: infrastructure health (is the model serving endpoint up, what is the latency, what is the error rate) and business metrics (revenue, conversion rate, user retention). The first is necessary but not sufficient. The second is real but lagged and noisy.
What is almost never measured is the thing that would actually detect a problem early: the distribution of inputs and outputs over time.
A model that is receiving inputs that have drifted from its training distribution will produce confident predictions that are systematically wrong. The serving endpoint is healthy. The latency is nominal. The error rate is zero. The model is returning predictions without raising exceptions. And the predictions are garbage, quietly, until enough business impact has accumulated that the business metrics finally move enough to notice.
The window between when the model starts producing bad predictions and when the business metrics reveal it can be weeks. In that window, decisions are being made on bad predictions. Users are being affected by bad recommendations. Actions are being taken on bad classifications.
Input distribution monitoring closes this window.
import numpy as np
from scipy import stats
from dataclasses import dataclass
from datetime import datetime, timezone
from typing import Optional
import logging

log = logging.getLogger(__name__)


@dataclass
class FeatureDriftReport:
    feature_name: str
    training_mean: float
    serving_mean: float
    training_std: float
    serving_std: float
    ks_statistic: float
    ks_p_value: float
    drift_detected: bool
    severity: str  # "none", "warning", "critical"


class FeatureDriftMonitor:
    """
    Monitors input feature distributions in production and
    compares them against the training baseline.

    Run this continuously. Alert on drift before users notice
    that predictions are wrong.
    """

    def __init__(
        self,
        training_baseline: dict[str, np.ndarray],
        ks_warning_threshold: float = 0.05,
        ks_critical_threshold: float = 0.01,
        min_samples: int = 1000,
    ):
        self.baseline = training_baseline
        self.ks_warning_threshold = ks_warning_threshold
        self.ks_critical_threshold = ks_critical_threshold
        self.min_samples = min_samples
        self.serving_buffer: dict[str, list[float]] = {
            feature: [] for feature in training_baseline
        }

    def record_inference(self, features: dict[str, float]) -> None:
        for feature_name, value in features.items():
            if feature_name in self.serving_buffer:
                self.serving_buffer[feature_name].append(value)

    def compute_drift_report(self) -> list[FeatureDriftReport]:
        reports = []

        for feature_name, training_values in self.baseline.items():
            serving_values = self.serving_buffer.get(feature_name, [])

            if len(serving_values) < self.min_samples:
                continue

            serving_array = np.array(serving_values)

            ks_stat, p_value = stats.ks_2samp(training_values, serving_array)

            if p_value < self.ks_critical_threshold:
                severity = "critical"
                drift_detected = True
            elif p_value < self.ks_warning_threshold:
                severity = "warning"
                drift_detected = True
            else:
                severity = "none"
                drift_detected = False

            report = FeatureDriftReport(
                feature_name=feature_name,
                training_mean=float(np.mean(training_values)),
                serving_mean=float(np.mean(serving_array)),
                training_std=float(np.std(training_values)),
                serving_std=float(np.std(serving_array)),
                ks_statistic=float(ks_stat),
                ks_p_value=float(p_value),
                drift_detected=drift_detected,
                severity=severity,
            )
            reports.append(report)

            if drift_detected:
                log.warning(
                    "feature.drift.detected",
                    feature=feature_name,
                    severity=severity,
                    ks_statistic=round(ks_stat, 4),
                    p_value=round(p_value, 6),
                    training_mean=round(report.training_mean, 4),
                    serving_mean=round(report.serving_mean, 4),
                )

        return reports

    def flush_buffer(self) -> None:
        for feature_name in self.serving_buffer:
            self.serving_buffer[feature_name] = []
The Kolmogorov-Smirnov test compares two distributions without assuming either is normal. A low p-value means the serving distribution is unlikely to have come from the same distribution as the training data. That is the signal that something has changed.
Running this hourly and alerting on critical drift gives you a detection window measured in hours rather than weeks. The model has not changed. What the model is seeing has changed. Knowing this immediately is the difference between investigating a data pipeline issue and running an expensive model retraining campaign that does not fix the actual problem.
Experiment tracking as operational necessity
Most teams use experiment tracking (MLflow, Weights and Biases, Neptune, similar) as a development tool. They track runs during experimentation, compare metrics across configurations, and use it to find the best model.
Then they deploy the best model and stop tracking things systematically.
This is where the operational picture falls apart. Six months after deployment, something changes in model behavior. The team wants to understand when it changed, what changed, and why. Without continuous tracking of production inference behavior, they cannot answer these questions. They know the model that was deployed. They do not know how its behavior has evolved since deployment.
Production inference should be tracked with the same discipline as training experiments.
import mlflow
import mlflow.pyfunc
from contextlib import contextmanager
from datetime import datetime, timezone
import hashlib
import json


class ProductionInferenceTracker:
    """
    Tracks production inference runs with the same discipline
    as training experiments.

    This is not for debugging individual predictions.
    It is for understanding how model behavior evolves over time.
    """

    def __init__(
        self,
        model_name: str,
        model_version: str,
        experiment_name: str = "production_inference",
        sample_rate: float = 0.01,  # Track 1% of inferences by default
    ):
        self.model_name = model_name
        self.model_version = model_version
        self.sample_rate = sample_rate
        mlflow.set_experiment(experiment_name)

    def should_track(self, request_id: str) -> bool:
        hash_val = int(hashlib.md5(request_id.encode()).hexdigest(), 16)
        return (hash_val % 10000) < (self.sample_rate * 10000)

    @contextmanager
    def track_inference(self, request_id: str, input_features: dict):
        if not self.should_track(request_id):
            yield None
            return

        with mlflow.start_run(tags={
            "type": "production_inference",
            "model_name": self.model_name,
            "model_version": self.model_version,
            "request_id": request_id,
        }) as run:
            mlflow.log_params({
                "model_name": self.model_name,
                "model_version": self.model_version,
                "inference_date": datetime.now(timezone.utc).date().isoformat(),
            })

            for feature_name, feature_value in input_features.items():
                if isinstance(feature_value, (int, float)):
                    mlflow.log_metric(f"input_{feature_name}", feature_value)

            yield run

    def log_prediction(
        self,
        run,
        prediction: float,
        prediction_label: Optional[str] = None,
        confidence: Optional[float] = None,
        latency_ms: Optional[float] = None,
    ) -> None:
        if run is None:
            return

        with mlflow.start_run(run_id=run.info.run_id):
            mlflow.log_metric("prediction_score", prediction)
            if confidence is not None:
                mlflow.log_metric("prediction_confidence", confidence)
            if latency_ms is not None:
                mlflow.log_metric("inference_latency_ms", latency_ms)


# Usage in the serving path:
tracker = ProductionInferenceTracker(
    model_name="churn_prediction",
    model_version="v2.3.1",
    sample_rate=0.01,
)

async def predict_churn(user_id: str, request_id: str) -> dict:
    features = await compute_user_features_for_serving(user_id)
    feature_dict = vars(features)

    import time
    start = time.perf_counter()

    with tracker.track_inference(request_id, feature_dict) as run:
        prediction = model.predict([list(feature_dict.values())])[0]
        confidence = float(model.predict_proba([list(feature_dict.values())])[0].max())
        latency_ms = (time.perf_counter() - start) * 1000

        tracker.log_prediction(
            run=run,
            prediction=prediction,
            confidence=confidence,
            latency_ms=latency_ms,
        )

    return {
        "user_id": user_id,
        "churn_probability": float(prediction),
        "confidence": confidence,
        "model_version": "v2.3.1",
    }
With this in place, when someone asks “has the model’s confidence distribution changed in the last three months,” you can answer that question. When someone asks “were the features that went into this specific prediction different from what we normally see,” you can answer that too. The production model is now as observable as the training experiments.
The pipeline as the product
The mistake that most ML teams make, and that most MLOps content reinforces, is treating the model as the product and the pipeline as the scaffolding.
The model is a static artifact. Once trained, it does not change. What changes is the world around it: the data flowing through the pipeline, the features being computed, the distribution of inputs, the downstream systems consuming the predictions. The pipeline is what connects the static model to the dynamic world, and it is the pipeline that determines whether the model continues to work.
A model with excellent evaluation metrics and a badly engineered pipeline will fail in production. A model with average evaluation metrics and a rigorous pipeline will remain useful far longer, because the pipeline ensures the model is always receiving inputs it was built to handle and that its behavior is continuously monitored.
This means the engineering investment that most teams deprioritise, feature stores, data validation, serving infrastructure, drift monitoring, is actually the investment that has the highest return.
Feature stores deserve specific mention because they are the most direct structural solution to training-serving skew and the most consistently underinvested in.
# A minimal feature store that prevents training-serving skew
# by making the same features available to both training and serving.
# Not a commercial feature store platform.
# The principle, implementable in an afternoon.

import redis
import json
from datetime import datetime, timezone, timedelta
from typing import Optional


class FeatureStore:
    """
    Single source of truth for features.
    Training reads historical features from here.
    Serving reads current features from here.
    The same computation logic populates both.
    """

    def __init__(self, redis_client: redis.Redis):
        self.redis = redis_client
        self.ttl_seconds = 3600  # Features valid for 1 hour

    def write_user_features(
        self,
        user_id: str,
        features: dict,
        as_of: Optional[datetime] = None,
    ) -> None:
        if as_of is None:
            as_of = datetime.now(timezone.utc)

        key = f"features:user:{user_id}"
        value = {
            **features,
            "_computed_at": as_of.isoformat(),
            "_schema_version": "1.2",
        }
        self.redis.setex(key, self.ttl_seconds, json.dumps(value))

    def read_user_features(self, user_id: str) -> Optional[dict]:
        key = f"features:user:{user_id}"
        raw = self.redis.get(key)
        if raw is None:
            return None

        features = json.loads(raw)

        computed_at = datetime.fromisoformat(features["_computed_at"])
        age_seconds = (datetime.now(timezone.utc) - computed_at).total_seconds()

        if age_seconds > self.ttl_seconds:
            return None

        return {k: v for k, v in features.items() if not k.startswith("_")}

    def read_user_features_or_compute(
        self,
        user_id: str,
        events: list,
    ) -> dict:
        cached = self.read_user_features(user_id)
        if cached is not None:
            return cached

        from features.user_features import compute_user_features
        features = compute_user_features(events)
        feature_dict = vars(features)
        self.write_user_features(user_id, feature_dict)
        return feature_dict
The feature store is not magic. It is a cache with discipline attached. The discipline is that the same function that computes features for the training dataset also populates the store, which the serving path reads from. The path from raw data to features is written once and travelled by both training and serving.
Retraining is not a fix, it is a maintenance cycle
Most teams treat model retraining as the response to degradation. The model gets worse, you retrain it, it gets better, you wait for it to get worse again.
This is reactive maintenance. It is the equivalent of operating a car by only changing the oil after the engine starts making noise.
Proactive retraining is a scheduled activity based on understanding of how quickly the world changes relative to the model’s training data, not a reaction to detected degradation. A model predicting user behavior in a product that changes frequently needs more frequent retraining than a model predicting physical properties of materials that are stable. The cadence should be derived from the domain, not from the lag of business metric detection.
# Retraining trigger logic that is proactive rather than reactive

from enum import Enum
from dataclasses import dataclass
from datetime import datetime, timedelta


class RetrainingTrigger(Enum):
    SCHEDULED = "scheduled"
    DRIFT_DETECTED = "drift_detected"
    PERFORMANCE_DEGRADED = "performance_degraded"
    DATA_VOLUME_THRESHOLD = "data_volume_threshold"


@dataclass
class RetrainingDecision:
    should_retrain: bool
    trigger: Optional[RetrainingTrigger]
    reason: str
    priority: str  # "low", "medium", "high", "critical"


class RetrainingPolicy:
    def __init__(
        self,
        max_model_age_days: int = 30,
        drift_severity_threshold: str = "warning",
        min_new_labeled_samples: int = 5000,
    ):
        self.max_model_age_days = max_model_age_days
        self.drift_severity_threshold = drift_severity_threshold
        self.min_new_labeled_samples = min_new_labeled_samples

    def evaluate(
        self,
        model_trained_at: datetime,
        drift_reports: list[FeatureDriftReport],
        new_labeled_samples: int,
        production_accuracy: Optional[float] = None,
        baseline_accuracy: Optional[float] = None,
    ) -> RetrainingDecision:
        model_age_days = (datetime.now(timezone.utc) - model_trained_at).days

        if model_age_days >= self.max_model_age_days:
            return RetrainingDecision(
                should_retrain=True,
                trigger=RetrainingTrigger.SCHEDULED,
                reason=f"Model is {model_age_days} days old, exceeds {self.max_model_age_days} day limit",
                priority="medium",
            )

        critical_drift = [r for r in drift_reports if r.severity == "critical"]
        if critical_drift:
            features = [r.feature_name for r in critical_drift]
            return RetrainingDecision(
                should_retrain=True,
                trigger=RetrainingTrigger.DRIFT_DETECTED,
                reason=f"Critical drift detected in features: {features}",
                priority="high",
            )

        if (
            production_accuracy is not None
            and baseline_accuracy is not None
            and production_accuracy < baseline_accuracy * 0.95
        ):
            degradation = (baseline_accuracy - production_accuracy) / baseline_accuracy
            return RetrainingDecision(
                should_retrain=True,
                trigger=RetrainingTrigger.PERFORMANCE_DEGRADED,
                reason=f"Production accuracy degraded {degradation:.1%} from baseline",
                priority="critical",
            )

        if new_labeled_samples >= self.min_new_labeled_samples:
            return RetrainingDecision(
                should_retrain=True,
                trigger=RetrainingTrigger.DATA_VOLUME_THRESHOLD,
                reason=f"{new_labeled_samples} new labeled samples available",
                priority="low",
            )

        return RetrainingDecision(
            should_retrain=False,
            trigger=None,
            reason="No retraining triggers met",
            priority="low",
        )
Retraining triggered by a policy is predictable and plannable. Retraining triggered by a production incident is expensive, urgent, and almost always accompanied by the discovery that the monitoring which should have caught the degradation earlier was not in place.
The real MLOps problem
The MLOps tooling ecosystem has matured significantly. There are good tools for experiment tracking, for model serving, for feature stores, for drift monitoring, for retraining pipelines. The tooling is not the bottleneck.
The bottleneck is a cultural assumption that ML systems are different from software systems and therefore do not require the same engineering rigour. The assumption is that the model is the hard part and the infrastructure is secondary. It produces teams that invest heavily in training and lightly in everything else.
The model is a function. Like any function in production software, its behavior depends on its inputs, its execution environment, and the infrastructure that delivers its outputs to the things that depend on them. When those things are engineered badly, the function produces bad results regardless of how well it was constructed.
The teams that run ML systems reliably in production are the teams that treat the pipeline with the same care as the model. They version their features with the same discipline as their code. They monitor input distributions with the same attention as service latency. They run retraining on a schedule rather than in response to incidents.
They spend less time debugging model behavior and more time maintaining model infrastructure. They have fewer production incidents, shorter incidents when they do occur, and higher confidence that the predictions their model is producing are based on inputs that resemble what the model was trained on.
The model is usually fine. Engineer the rest of it accordingly.